February 23, 2026
Why Your Wearable Data Isn't the Problem — Your Interpretation Is
Drowning in HRV scores and readiness numbers? The data isn't the enemy. Here's how to actually make sense of what your wearable is telling you.
Why Your Wearable Data Isn't the Problem — Your Interpretation Is
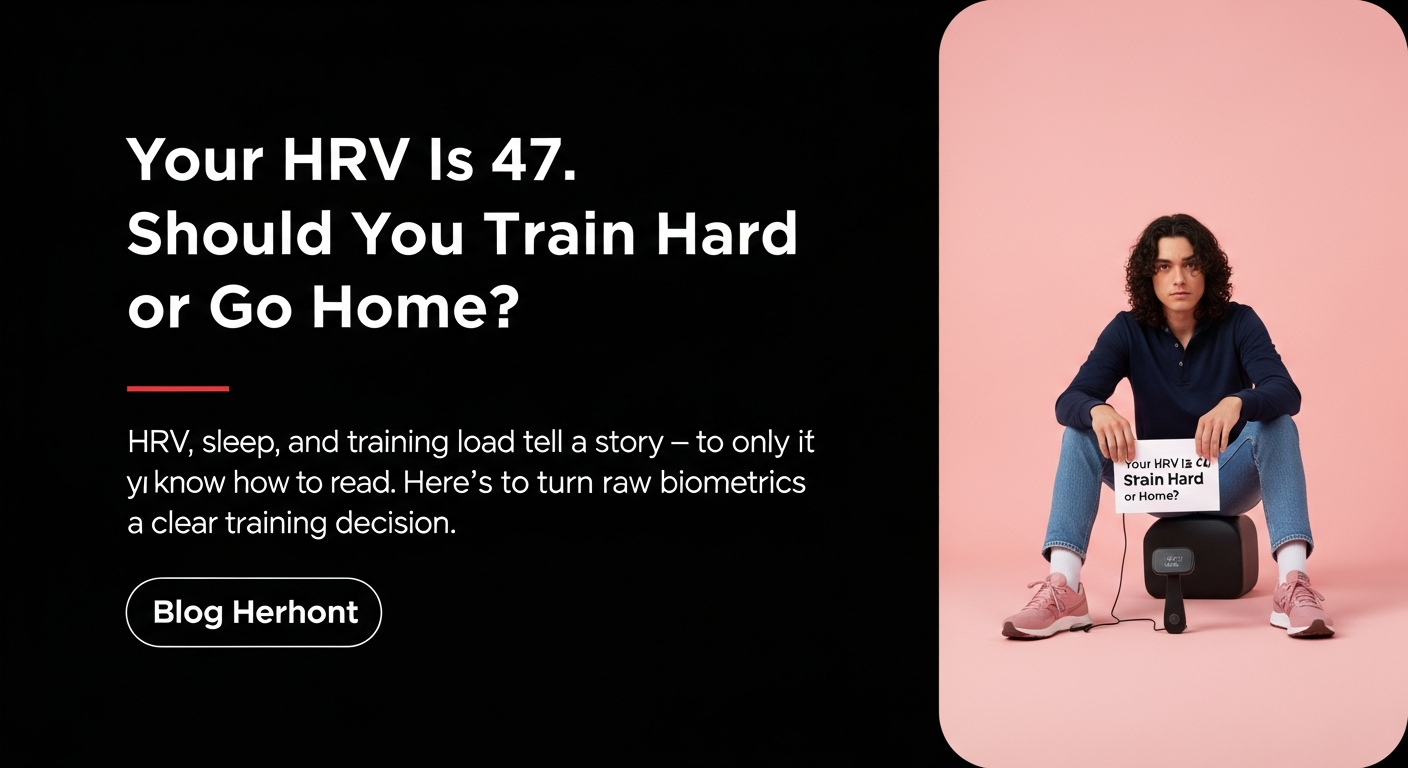
You checked your watch before your alarm even went off. HRV down 14%. Resting heart rate up four beats. Recovery score: 43 out of 100. And now you're lying in bed at 5:52 a.m. wondering whether to cancel the track session you've been building toward all week.
That moment — the one where data meant to help you starts stressing you out — is where a lot of athletes quietly lose the plot.
Here's the thing: the data isn't wrong. Your wearable is doing exactly what it was designed to do. The problem is the gap between what the numbers say and what you're supposed to do with them. That gap, if nobody helps you cross it, turns useful information into low-grade anxiety.
Let's fix that.
The Real Reason Data Fatigue Happens
Data fatigue isn't about having too much information. It's about having information without context.
Think about it this way. If a doctor handed you a printout of your bloodwork and walked out of the room without saying a word, you'd panic. Not because the numbers were necessarily bad, but because raw data without interpretation is just noise with authority. It feels meaningful without actually being actionable.
That's what most wearable platforms do. They hand you the printout and leave.
A 2026 Global Wellness Summit report identified what they called a "Revenge of the Human" trend — a growing backlash against fitness tech that makes people feel surveilled rather than supported. Athletes who've been tracking for years are reporting that their dashboards create dread instead of direction. Streaks become pressure. Recovery scores become shame. HRV dips become omens.
None of that was the point. The point was always to train smarter. Somewhere along the way, the tool became the task.
What Your Wearable Is Actually Good At
Before we talk about interpretation, it's worth understanding what these devices genuinely do well — because they're not useless. Far from it.
Modern wearables are excellent at capturing trends over time. A single night's HRV reading tells you almost nothing in isolation. But 30 days of HRV data, plotted against your training load, sleep consistency, and resting heart rate? That tells a story.
Here's what the better devices track with reasonable accuracy:
- Resting heart rate trends — a reliable early signal of accumulated fatigue or incoming illness
- Sleep duration and timing consistency — not just how long you slept, but whether your sleep schedule is stable week to week
- Heart rate variability (HRV) — a proxy for your autonomic nervous system's balance between stress and recovery
- Training load and strain — how much physiological stress you've accumulated over days and weeks
The keyword there is trends. A single data point is a snapshot. Trends are the movie. Most people are trying to make decisions from one frame.
The Metrics That Trip Athletes Up Most
HRV: Useful, Misunderstood, Easily Panicked Over
Heart rate variability is probably the most misread metric in amateur endurance sport. Here's what it actually is: a measure of the variation in time between consecutive heartbeats. Higher variability generally indicates your nervous system is in a recovered, adaptive state. Lower variability suggests stress — physical, emotional, or both.
What it doesn't tell you is why it's low. A hard long run, a poor night's sleep, a stressful work week, a couple of drinks, a head cold coming on — all of these can suppress HRV. The number alone can't distinguish between them.
This is where a lot of athletes go wrong. They see a suppressed HRV and immediately assume they're overtrained, when really they just had a bad night's sleep because their kid was up at 2 a.m. Context matters enormously.
A good rule of thumb: if your HRV drops more than 10-15% below your personal baseline for two or more consecutive days alongside other signals (elevated resting HR, poor sleep, heavy legs), that's worth paying attention to. One low reading in isolation? Note it, don't catastrophise it.
Readiness Scores: Decision Aids, Not Verdicts
Imagine you're a cyclist three weeks out from your A-race. You've been building load consistently, your fitness is peaking, and then you wake up to a readiness score of 38. Do you abandon the session?
Probably not — but you might modify it.
That's the right mental model for readiness scores. They're not a green light or a red light. They're a calibration signal. A low score on a day when you're feeling surprisingly good might mean you push through at 80% instead of 100%. A low score on a day when your legs feel like concrete and your motivation is nonexistent? That's your body and your data aligned — listen to both.
The mistake is treating the score as binary. Train or don't train. The reality is almost always more nuanced: train, but how? At what intensity? For how long?
How to Actually Interpret Your Data
Here's a practical framework that works whether you're a runner, cyclist, triathlete, or anyone in between.
Step 1: Look at the trend, not the day. Before you react to today's numbers, scroll back seven days. Is this a one-off dip or part of a pattern? Patterns mean something. Single data points usually don't.
Step 2: Cross-reference with how you feel. This sounds obvious, but a lot of athletes have been trained to distrust their own perception in favour of the device. Don't. Your subjective feeling of fatigue, motivation, and muscle heaviness is data too — arguably the most important data. If your readiness score is 70 and you feel absolutely wrecked, trust your body. If your score is 45 and you feel surprisingly good, you probably have more in the tank than the algorithm thinks.
Step 3: Ask one question. Not "should I train?" but "what kind of effort makes sense today?" The answer is almost never zero. It's usually somewhere on a spectrum: full intensity session, reduced volume, easy aerobic work, mobility and recovery, or genuine rest. Most days fall in the middle of that range.
Step 4: Ignore the noise. Notifications, streak counters, weekly comparisons to other users — these are engagement features, not coaching tools. The moment you start training to protect a streak rather than to build fitness, you've let the app coach you instead of the other way around.
The Longevity Angle Nobody Talks About Enough
There's a shift happening in how serious athletes think about performance. The goal is no longer just the next PR — it's staying healthy, mobile, and competitive for decades. That reframe changes everything about how you should use your data.
Short-term over-optimization — grinding through sessions when your body is clearly asking for recovery — might get you to the start line faster. But it also increases injury risk, suppresses immune function, and accelerates burnout. Research consistently shows that athletes who prioritise recovery alongside load accumulation sustain higher performance levels over multi-year periods than those who chase every training session regardless of readiness.
Your wearable, used correctly, is a longevity tool. It's telling you when to back off so you can keep going — not for this season, but for the next ten.
When the Data and Your Gut Disagree
Here's a scenario worth sitting with. You've got a key workout on the plan. Your coach wrote it, you've been anticipating it, and your training partner is counting on you. But your readiness score is low and you slept terribly.
What do you do?
First: acknowledge that neither the data nor your gut is automatically right. The algorithm doesn't know about your race in six weeks or the fact that you've been carrying extra stress from work. Your gut doesn't always account for the fact that you've been systematically under-recovering for three weeks.
The answer is usually a negotiation. Show up. Warm up properly. Reassess after 15-20 minutes of easy effort. If the body wakes up and the session starts to feel possible, continue — maybe at 85-90% of planned intensity. If it still feels wrong after a proper warm-up, that's real information. Modify or cut the session short without guilt.
Data should inform the decision. It shouldn't make it for you.
The Bottom Line
Your wearable is a remarkably useful tool. But a tool is only as good as the person interpreting it — and right now, most platforms leave that interpretation entirely up to you, with very little guidance on how to do it well.
The athletes who get the most out of their data aren't the ones who track the most metrics. They're the ones who've learned to ask better questions of their numbers, cross-reference them with how they actually feel, and make decisions that serve their long-term health as much as their next training session.
Stop looking for the number that tells you what to do. Start using the numbers to have a better conversation with your own body. That's where the real gains are — and they compound in ways no single readiness score ever will.